The Question analytics feature provides an analysis of the questions that have been added to your test. It helps you to determine the usability factor of each question in your test.
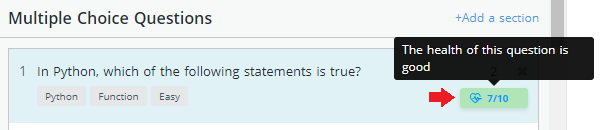
This report is generated by performing various analyses based on different parameters. The score that is assigned to a question determines the health of the question. This allows you to decide whether or not to add this question to your test.
The following score parameters are used to calculate the health of a question:
- 0-2.9: The health of the question is low.
- 3-6.9: The health of the question is satisfactory.
- 7-10: The health of the question is good.
Note: Currently, the question analytics section is available only for MCQs and programming questions.
Viewing the question analytics section
To view the question analytics section, follow these steps:
- Log into HackerEarth Assessment by using your admin credentials.
- Click Tests.
- Click Ongoing.
- Click the name of the test in which you want to view the Question analytics section.
- In the Test details section, click Questions.
- Click the MCQ or programming question for which you want to view the Question analytics section.
- Click Analytics.
You have successfully viewed the question analytics for this question.
Parts of the Question analytics section
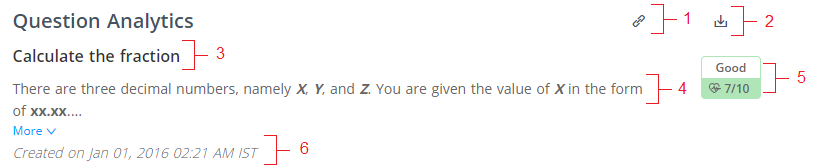
The initial analysis of a question is as follows:
Attributes used for analysis
| S. No. | Description |
| 1 | Copy the link to the question analytics report so that anyone can view the report without having to log into HackerEarth Assessment |
| 2 | Download the Question analytics report in PDF |
| 3 | Name of the problem |
| 4 | Problem description |
| 5 | Health and score of the question |
| 6 | Date and time when the question is created |
Attempt rate of the question
You can view the number of candidates who have successfully solved and attempted the question. 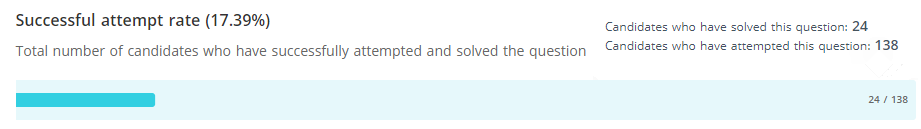
Attempt rate of the question in different programming languages
You can view the number of candidates who have solved and attempted the question in a specific programming language.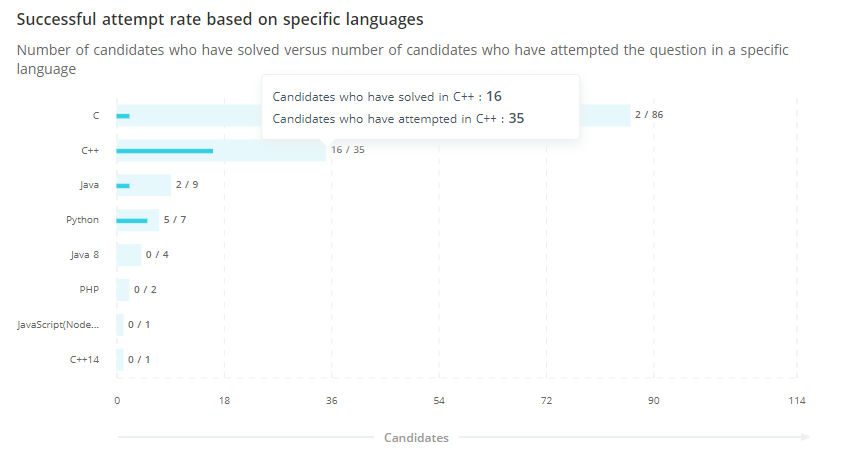
- The X-axis represents the number of candidates.
- The Y-axis represents different programming languages in which the candidates have attempted the question.
If you hover over a bar, then the number of candidates who have solved and attempted the question in that specific programming language is displayed. For example, if you place your cursor on the C++ bar, then you can see that 16 candidates have solved that question and 35 candidates have attempted that question in C++.
Important: This distribution is not available for MCQs.
Score distribution
You can view the distribution of scores that are obtained by the candidates who have attempted a specific question.
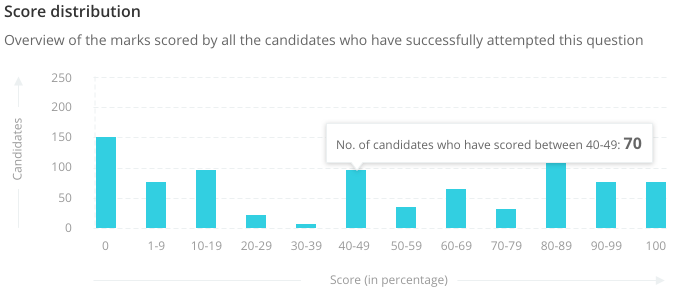
- The X-axis represents the ranges of scores obtained by the candidates.
- The Y-axis represents the number of candidates. If you hover over a bar, then the exact number of candidates who have scored within that specific score range is displayed.
For example, if you hover over the bar of the score range 40-49, then you see that 70 candidates have scored within that specific range.
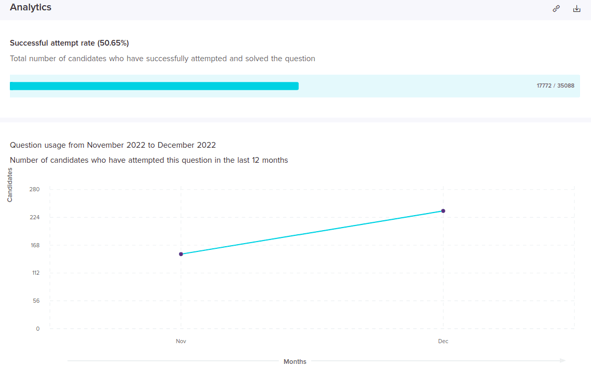
Question usage
You can view the volume of usage of a question in a specific year starting from September of that year to August of the next year. This distribution represents the number of candidates who have attempted this question in a specific month.
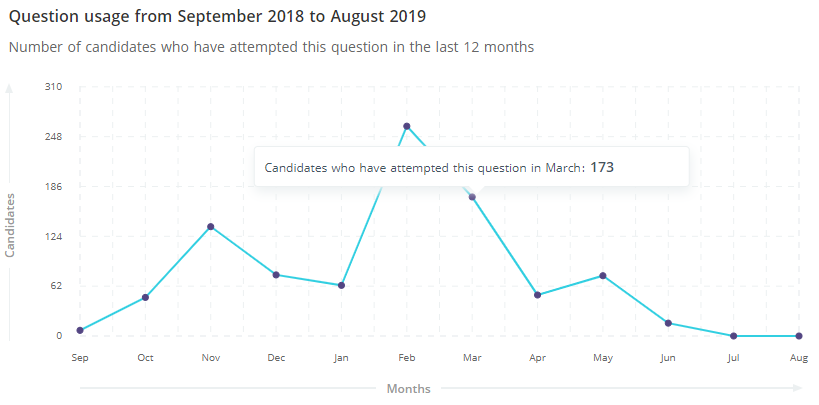
- The X-axis represents the months in a year.
- The Y-axis axis represents the number of candidates. If you hover over
 , then the number of candidates who have attempted this question in a specific month is displayed.
For example, if you place your cursor on the point that is present above March 2019, then you see that 173 candidates have attempted that question in March 2019.